
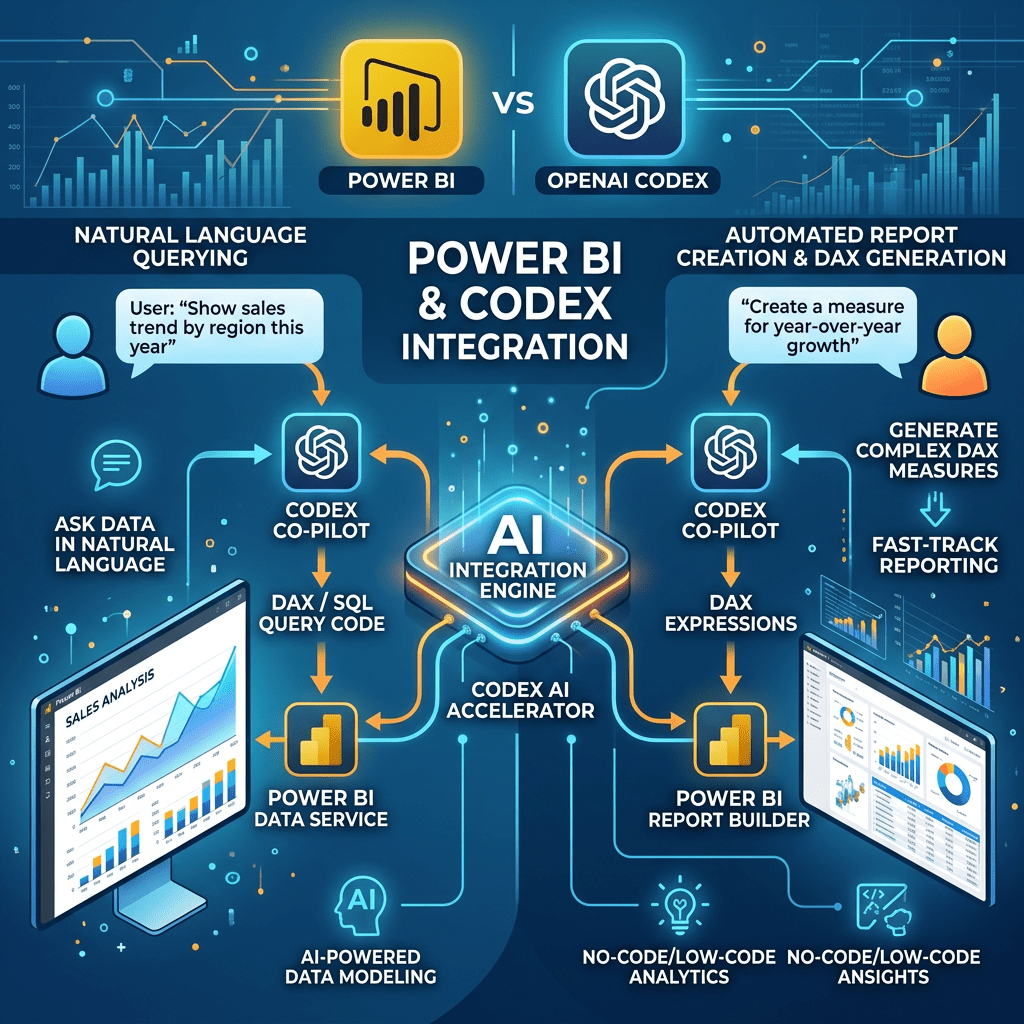
Power BI report development is moving beyond traditional drag-and-drop design.
With Codex, Power BI Project files, TMDL, PBIR, Microsoft Fabric APIs, and automated deployment pipelines, development teams can now generate Power BI reports using code—without manually opening Power BI Desktop.
This approach transforms Power BI development into a modern software engineering workflow where reports can be created, validated, version-controlled, reviewed, and deployed through automation.
Can Codex Build a Power BI Report?
Yes. Codex can help create and maintain the core components of a Power BI project.
- Semantic models
- Tables and columns
- Relationships
- DAX measures
- Report pages
- Charts and visualizations
- Filters and slicers
- Themes and formatting
- Deployment scripts
- Validation scripts
- CI/CD pipelines
Instead of manually placing every visual in Power BI Desktop, developers can describe the required dashboard in plain English. Codex can then generate the required Power BI project files.
Traditional Power BI Development vs Codex-Based Development
Traditional approach
- Open Power BI Desktop.
- Connect to the data source.
- Create relationships.
- Write DAX measures.
- Add report pages.
- Drag and drop visuals.
- Apply formatting.
- Publish the report.
- Repeat the same process for every environment.
This approach works well, but it can become difficult to scale across multiple reports, customers, developers, and environments.
Codex-based approach
- Define the report requirements.
- Provide the data model structure.
- Ask Codex to generate the semantic model.
- Generate DAX measures.
- Create report pages and visuals.
- Validate the project files.
- Commit the project to Git.
- Deploy the report to Microsoft Fabric or Power BI Service.
This approach makes Power BI development repeatable, testable, and easier to automate.
Recommended Architecture
A modern Power BI automation workflow can use the following architecture:
Business Requirements ↓Codex ↓Power BI Project Files ↓TMDL Semantic Model ↓PBIR Report Definition ↓Validation ↓Git Repository ↓CI/CD Deployment ↓Power BI Service or Microsoft Fabric
The most important technologies in this architecture are:
- PBIP
- TMDL
- PBIR
- Codex
- Git
- Microsoft Fabric APIs
- Fabric CI/CD
What Is PBIP?
PBIP stands for Power BI Project.
A PBIP project stores a Power BI report as a collection of text-based files and folders instead of a single binary PBIX file.
This makes the report easier to:
- Store in Git
- Compare across versions
- Review through pull requests
- Modify through scripts
- Generate using AI agents
- Deploy through automated pipelines
A typical Power BI project may look like this:
SalesDashboard/│├── SalesDashboard.pbip├── SalesDashboard.SemanticModel/│ ├── definition.pbism│ └── definition/│ ├── model.tmdl│ ├── relationships.tmdl│ └── tables/│├── SalesDashboard.Report/│ ├── definition.pbir│ └── definition/│ ├── report.json│ ├── pages/│ └── bookmarks/│├── deploy.py└── README.md
Because most of these files are text-based, Codex can read, generate, and update them.
What Is TMDL?
TMDL stands for Tabular Model Definition Language.
It is used to define the semantic model behind the Power BI report.
TMDL can represent:
- Tables
- Columns
- Data types
- Measures
- Relationships
- Hierarchies
- Formatting
- Model metadata
For example, Codex can generate a measure such as:
measure 'Total Sales' = SUM(Sales[Amount]) formatString: "₹#,0"
It can also generate more advanced DAX measures such as:
- Year-to-date sales
- Previous-year sales
- Growth percentage
- Budget variance
- Utilization percentage
- Conversion rate
- Profit margin
This makes semantic-model development much more automation-friendly.
What Is PBIR?
PBIR stands for Power BI Enhanced Report Format.
PBIR stores the report definition as structured files.
It can represent:
- Report pages
- Visuals
- Visual positions
- Visual sizes
- Filters
- Slicers
- Bookmarks
- Drill-through settings
- Formatting
- Report-level properties
Codex can generate or modify these files to create report layouts without manually placing every visual in Power BI Desktop.
For example, a business requirement can be written as:
Create an Executive Summary page with:- Total Revenue card- Total Customers card- Revenue Growth card- Monthly Revenue line chart- Revenue by Region bar chart- Top Customers table- Date slicer- Region slicer
Codex can translate this requirement into the corresponding Power BI report definition.
Example Business Requirement
Before asking Codex to generate the report, create a requirements file.
# Sales Dashboard## Data SourceAzure SQL Database## Tables- Sales- Customer- Product- Date## Relationships- Sales.CustomerId to Customer.CustomerId- Sales.ProductId to Product.ProductId- Sales.OrderDate to Date.Date## Measures- Total Sales- Total Orders- Average Order Value- Sales YTD- Previous Year Sales- YoY Growth Percentage## Executive Summary Page- Total Sales card- Total Orders card- Average Order Value card- Monthly Sales trend- Sales by Region- Top Products- Date slicer- Region slicer## Product Analysis Page- Sales by Category- Sales by Product- Quantity Sold- Profit Margin- Product drill-through## Theme- Professional corporate design- White background- Green primary colour- Dark grey text- Responsive visual layout
This file acts as the contract between the business team and the AI development agent.
Example Codex Prompt
A structured Codex prompt can look like this:
Read the report requirements file.Create a complete Power BI PBIP project named SalesDashboard.Generate:1. A TMDL semantic model2. All required tables and relationships3. Explicit DAX measures4. An Executive Summary page5. A Product Analysis page6. Date and Region slicers7. Drill-through navigation8. A reusable corporate theme9. Validation scripts10. A deployment scriptDo not create implicit measures.Ensure that all visual field references match the semantic model.Validate all JSON, PBIR, and TMDL files before deployment.
The quality of the output depends heavily on how clearly the requirements are defined.
Deploying the Report Without Power BI Desktop
After Codex creates the Power BI project, the report can be deployed using automated scripts.
One option is to use a Fabric CI/CD library.
import argparsefrom azure.identity import InteractiveBrowserCredentialfrom fabric_cicd import FabricWorkspace, publish_all_itemsdef main() -> None: parser = argparse.ArgumentParser() parser.add_argument( "--workspace", required=True, help="Target Microsoft Fabric workspace" ) parser.add_argument( "--environment", default="dev", choices=["dev", "test", "prod"] ) args = parser.parse_args() credential = InteractiveBrowserCredential() workspace = FabricWorkspace( workspace_name=args.workspace, environment=args.environment, repository_directory=".", item_type_in_scope=[ "SemanticModel", "Report" ], token_credential=credential ) publish_all_items(workspace)if __name__ == "__main__": main()
The script can then be executed from a terminal or CI/CD pipeline.
python deploy.py --workspace "BooNars Analytics Dev"
The semantic model should be deployed first, followed by the report that depends on it.
Deployment Using Fabric REST APIs
Power BI and Microsoft Fabric items can also be managed through REST APIs.
A deployment service can:
- Create a semantic model
- Create a report
- Update an existing report
- Trigger refreshes
- Move content between environments
- Check deployment status
- Manage workspace items
This makes it possible to build an end-to-end automation service around Power BI development.
Developer Requirement ↓Codex Generates Project ↓Automated Validation ↓Pull Request ↓Development Workspace ↓Testing and Approval ↓Production Workspace
Can Power BI Desktop Be Removed Completely?
Power BI Desktop can be removed from the daily development workflow, but there are some practical considerations.
Codex can generate the report files, semantic model, measures, and deployment scripts. However, the final visual output should still be reviewed.
The report can be reviewed directly in Power BI Service or Microsoft Fabric after deployment.
Codex performs report development ↓Automated scripts validate the project ↓Report is deployed to a development workspace ↓Business users review it in the browser ↓Approved changes move to production
Power BI Desktop is therefore no longer required for every development change. It may still be useful occasionally for troubleshooting, testing unsupported visuals, or inspecting rendering differences.
Important Challenges
Visual positioning
Every visual requires coordinates, dimensions, and layout properties. A reusable layout template helps Codex generate consistent report pages.
Schema validation
A report may fail when a visual refers to:
- A missing column
- An incorrect table name
- A renamed measure
- An invalid relationship
- An unsupported visual property
Automated validation is essential.
Rendering verification
A JSON file may be technically valid but still produce a poor visual layout. Reports should be deployed to a development workspace and reviewed in the browser.
Custom visuals
Some custom visuals may have additional configuration requirements. Standard native Power BI visuals are easier to generate and maintain.
Data-source credentials
Codex can generate the model and report, but credentials and gateway configuration must still be secured properly. Secrets should never be stored directly inside the report repository.
Best Practices
Use explicit measures
Avoid implicit measures. Create properly named and formatted DAX measures.
Maintain a naming convention
RevenueRevenue YTDRevenue Previous YearRevenue YoY %Customer CountOrder CountAverage Order Value
Use reusable templates
- Executive dashboards
- Sales dashboards
- Operations dashboards
- Finance reports
- Audit dashboards
- CRM reports
- Project-management reports
Separate environments
- Development
- Testing
- User acceptance testing
- Production
Validate before deployment
- JSON syntax
- TMDL syntax
- Duplicate measure names
- Missing table references
- Missing column references
- Broken relationships
- Invalid visual bindings
Use Git
Every report change should be version-controlled.
- Change history
- Rollback
- Code review
- Collaboration
- Release management
- Environment promotion
Creating a Power BI Report Factory
Organizations that build multiple dashboards can create a reusable Power BI Report Factory.
powerbi-report-factory/│├── templates/│ ├── executive-dashboard/│ ├── sales-dashboard/│ ├── audit-dashboard/│ ├── operations-dashboard/│ └── finance-dashboard/│├── themes/├── schemas/├── prompts/├── validators/├── deployment/└── projects/
A user can then submit a business request such as:
Create a project utilization dashboard.Source:Microsoft DataverseTables:ProjectsResourcesTime EntriesCustomersMeasures:Total HoursBillable HoursNon-Billable HoursUtilization PercentageBudget VarianceRevenuePages:Executive SummaryResource AnalysisProject AnalysisCustomer Analysis
Codex can use an existing template, generate the report, validate it, and deploy it. This dramatically reduces report-development time.
Where This Approach Adds the Most Value
- Consulting companies
- Microsoft Dynamics 365 partners
- Product companies
- Enterprise analytics teams
- Managed-service providers
- Organizations with multiple business units
- Organizations producing similar reports for multiple customers
For Microsoft Dynamics 365 and Power Platform projects, the same approach can be used to generate dashboards for:
- Sales
- Customer service
- Field service
- Project operations
- Marketing
- Finance
- Resource utilization
- Case management
- Audit and compliance
- Executive reporting
Future of Power BI Development
Power BI development is becoming more agent-driven.
Instead of asking developers to manually create every chart, businesses will define:
- The business goal
- The required KPIs
- The data source
- The intended audience
- The report layout
- The security model
AI agents will generate, test, deploy, and maintain the report.
The role of the Power BI developer will evolve from visual builder to analytics architect.
Developers will focus more on:
- Data quality
- Semantic-model design
- Business logic
- Governance
- Security
- Performance
- Reusable standards
- Deployment automation
The report itself becomes software.
Conclusion
Codex can be used to create Power BI reports without manually opening Power BI Desktop.
By combining PBIP, TMDL, PBIR, Git, validation scripts, Microsoft Fabric, and automated deployment, organizations can establish a scalable code-first Power BI development process.
Requirements ↓Codex ↓PBIP Project ↓TMDL and PBIR ↓Automated Validation ↓Git ↓Fabric Deployment ↓Browser-Based Review
This approach delivers faster development, consistent report design, stronger governance, reliable version control, and repeatable deployment.
Build Smarter Power BI Solutions with BooNars
At BooNars, we help businesses modernize Power BI, Microsoft Dynamics 365, Power Platform, Azure, and enterprise reporting solutions through automation-first architecture.
Whether you need a reusable Power BI Report Factory, automated Fabric deployment, Dynamics 365 analytics, or enterprise reporting governance, our team can help you design and implement the right solution.

Leave a comment